Mean, Median, Mode, and Range: A Parent's Complete Guide to 6th Grade Statistics
Confused by mean, median, mode, and range? This parent-friendly guide breaks down 6th grade statistics with simple definitions, step-by-step calculations, and everyday examples you can use at home.
Why Mean, Median, Mode, and Range Matter in 6th Grade
When your 6th grader comes home talking about "measures of central tendency," it can feel like they're speaking a foreign language. But here's the reassuring truth: mean, median, mode, and range are four simple concepts that form the foundation of statistics, and they're more relevant to everyday life than you might think.
These four measures help us make sense of data, whether it's understanding sports statistics, comparing prices while shopping, or analyzing test scores. In 6th grade, students learn these concepts because they're essential building blocks for more advanced math in middle school, high school, and beyond. Your child will encounter them on state tests, in science classes analyzing experimental data, and eventually in real-world situations like understanding salary ranges or evaluating product reviews.
The good news? You don't need a math degree to understand these concepts or help your child. With a few simple explanations and everyday examples, you can become your child's statistics coach. Let's break down each concept so you feel confident supporting your 6th grader's learning journey.
What Is Mean, Median, Mode, and Range? Simple Definitions
Before we get into calculations, let's establish clear definitions for each term. Understanding what each measure represents is half the battle.
Mean (Average) The mean is what most people call the "average." Think of it as the "fair share." If you divided everything equally among all values, what would each one get? For example, if three friends have 2, 4, and 6 candies, the mean is 4 candies per person because if they shared equally, everyone would have 4.
Median (Middle Value) The median is the middle number when all values are arranged in order. It splits the data in half, with 50% of values above and 50% below. The median is especially useful when you have outliers (extreme values) that might skew the mean.
Mode (Most Frequent) The mode is simply the value that appears most often in a data set. A data set can have one mode, multiple modes (if several values tie for most frequent), or no mode at all (if every value appears only once).
Range (Spread) The range measures how spread out the data is. It's calculated by subtracting the smallest value from the largest value. A large range means the data is widely spread; a small range means the values are clustered closely together.
Each of these measures tells a different story about the same data. That's why statisticians use all four to get a complete picture.
How to Calculate Each Measure: Step-by-Step Breakdowns
Now let's walk through how to calculate each measure. We'll use the same data set throughout so you can see how each calculation works: 3, 7, 7, 9, 14
Calculating the Mean
- Add all the numbers together: 3 + 7 + 7 + 9 + 14 = 40
- Count how many numbers there are: 5 numbers
- Divide the sum by the count: 40 ÷ 5 = 8
The mean of this data set is 8. Remember the "fair share" concept: if you distributed 40 items among 5 people equally, each person gets 8.
Calculating the Median
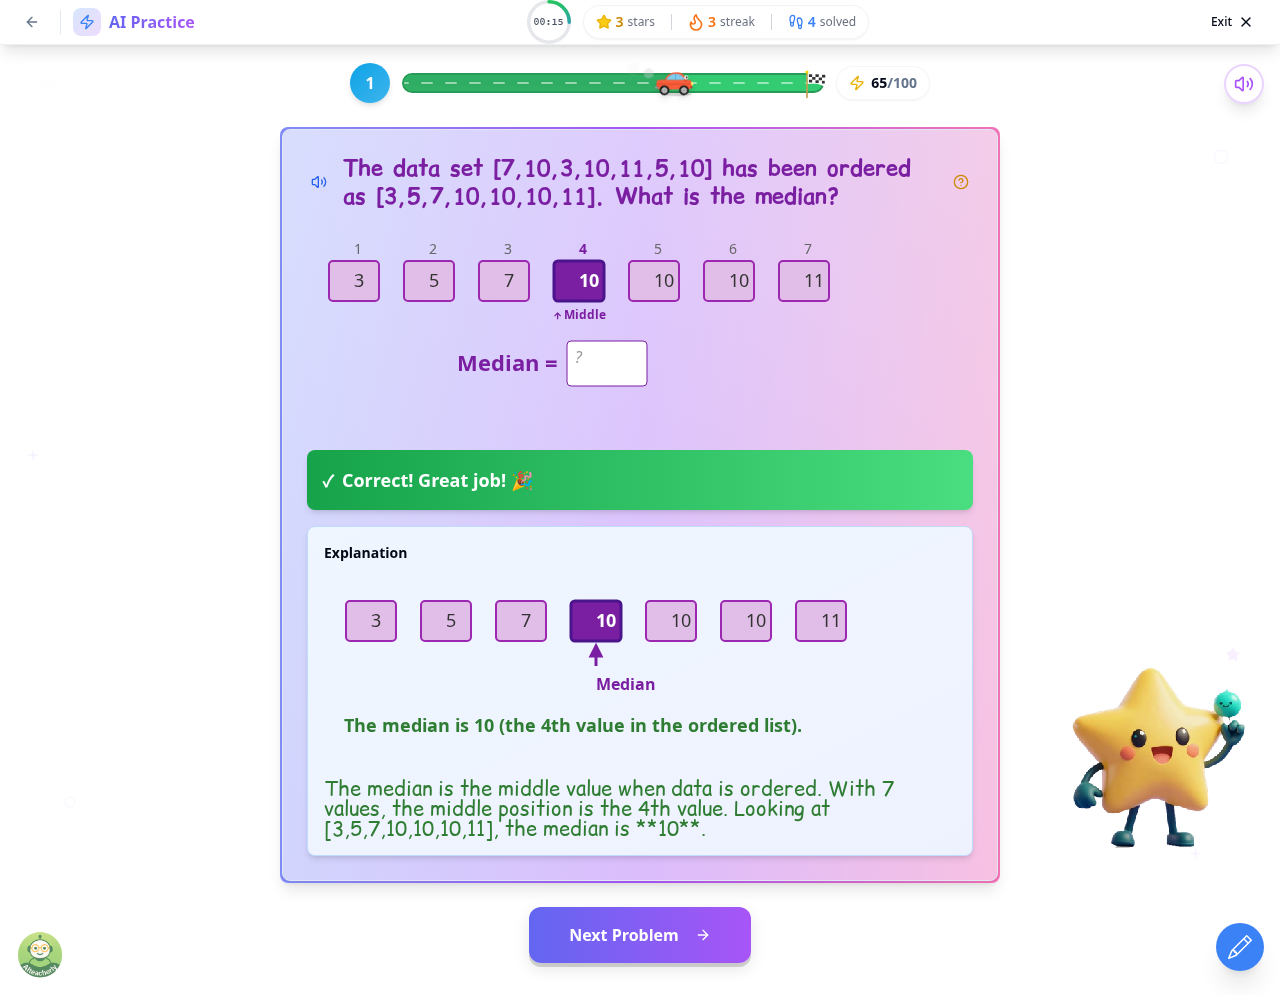
- First, arrange the numbers in order (already done): 3, 7, 7, 9, 14
- Find the middle position: With 5 numbers, the middle is the 3rd number
- Identify that number: 7
The median is 7. Note: If you have an even count of numbers, you'll find the two middle numbers and calculate their average.
Finding the Mode Look for the number that appears most often: 3 appears once, 7 appears twice, 9 appears once, 14 appears once. The mode is 7.
Calculating the Range Subtract the smallest from the largest: 14 - 3 = 11
The range is 11, telling us the data spans 11 units from lowest to highest.
The interactive problem below demonstrates exactly how students practice finding the median by first ordering their data set on AI Teacherly.
What's the Difference Between Mean and Median?
One of the most common questions students (and parents!) have is: "When do I use mean versus median?" Understanding this distinction is crucial for data literacy.
Mean is best when:
- Your data is fairly evenly distributed without extreme outliers
- You want to account for every single value in your calculation
- You're dealing with test scores, temperatures, or other measurements where outliers aren't a major concern
Median is better when:
- Your data has outliers (extreme high or low values)
- You want to find the "typical" value without being skewed by extremes
- You're looking at things like house prices, incomes, or ages where a few extreme values can distort the picture
A Real-World Example: Imagine five employees at a small company earn these salaries: $30,000, $35,000, $40,000, $45,000, and $500,000 (the CEO).
- Mean salary: $130,000 (skewed high by the CEO's salary)
- Median salary: $40,000 (represents the typical employee better)
This is why you often hear about "median household income" in news reports rather than "average income." The median gives a more accurate picture of what a typical family earns without being pulled upward by billionaires.
Teaching your child this distinction helps them become critical thinkers about the statistics they encounter in the news, advertisements, and social media.
Real-Life Examples to Practice at Home
The best way to reinforce mean, median, mode, and range is through everyday situations your child already cares about. Here are practical examples you can use tonight:
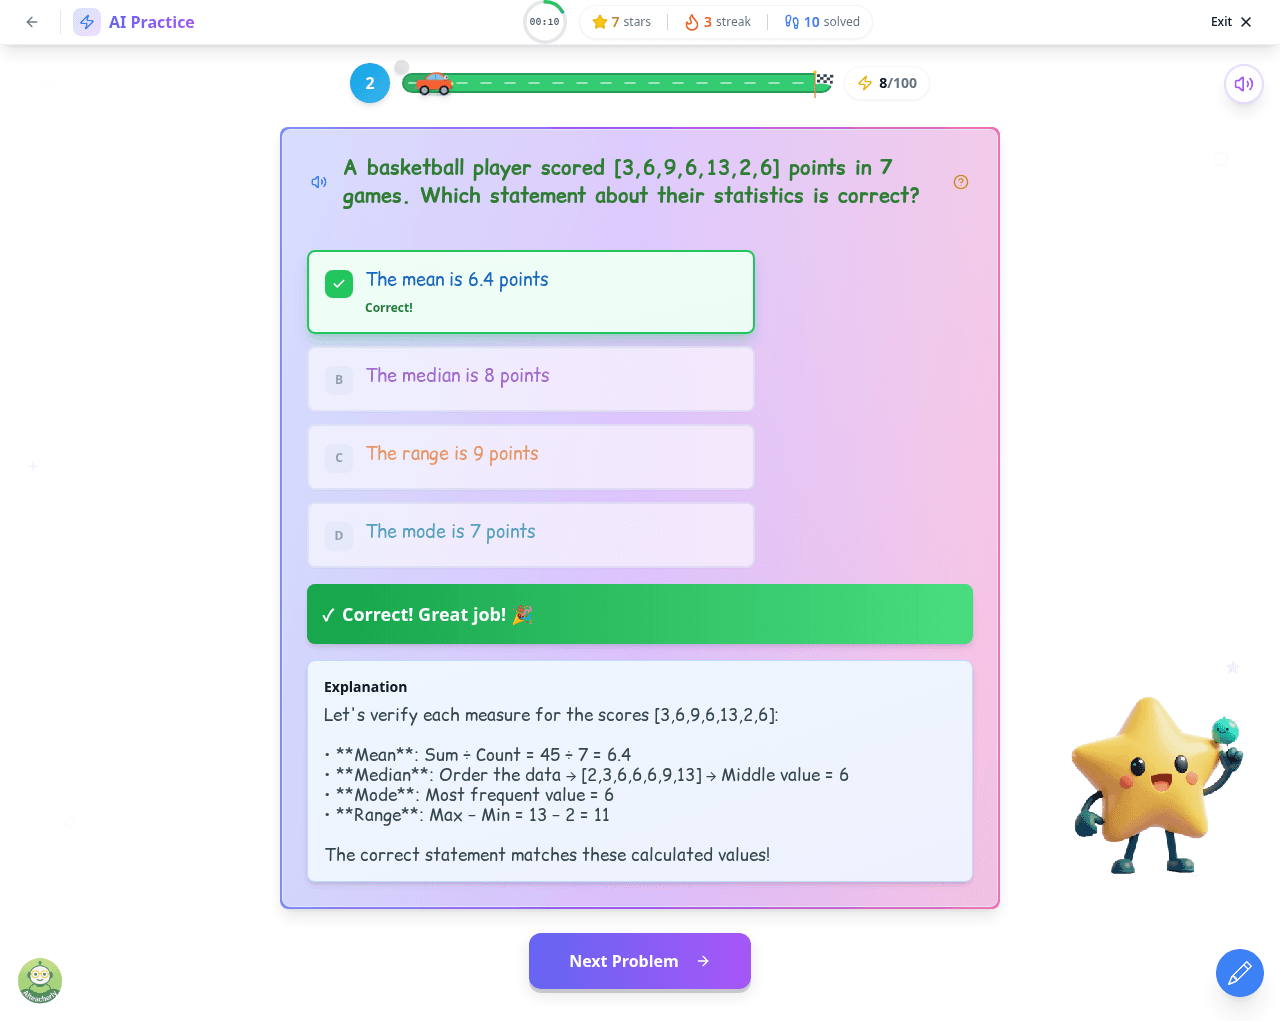
Sports Statistics If your child follows basketball, baseball, or any sport, they're already surrounded by statistics. Track a favorite player's points over several games, then calculate:
- Mean: What's their average points per game?
- Median: What's their typical performance?
- Mode: What score do they hit most often?
- Range: How consistent are they? (Small range = consistent; large range = variable)
Allowance and Savings Track weekly spending or savings over a month:
- "You saved $5, $10, $3, $10, and $7 this month. What's your average weekly savings?"
- "Which amount did you save most often?" (Mode)
Test Scores Gather recent quiz or test grades:
- Calculate the mean to see overall performance
- Find the median to see the "middle" performance
- Discuss what the range reveals about consistency
Temperature Tracking Check the daily high temperature for a week:
- "What was the average high this week?"
- "What's the temperature range for the week?"
- "If there's a heat wave day, how does that affect the mean vs. median?"
Shopping and Prices When grocery shopping or comparing products online:
- Compare unit prices and find the mean cost
- Identify the mode (most common price point)
- Calculate the range to see the price spread
These activities make abstract concepts tangible and show your child that statistics are genuinely useful in daily life.
See How Interactive Statistics Lessons Work
While real-world practice is valuable, structured lessons with immediate feedback help students master these concepts faster. This is where interactive learning platforms like AI Teacherly make a difference.
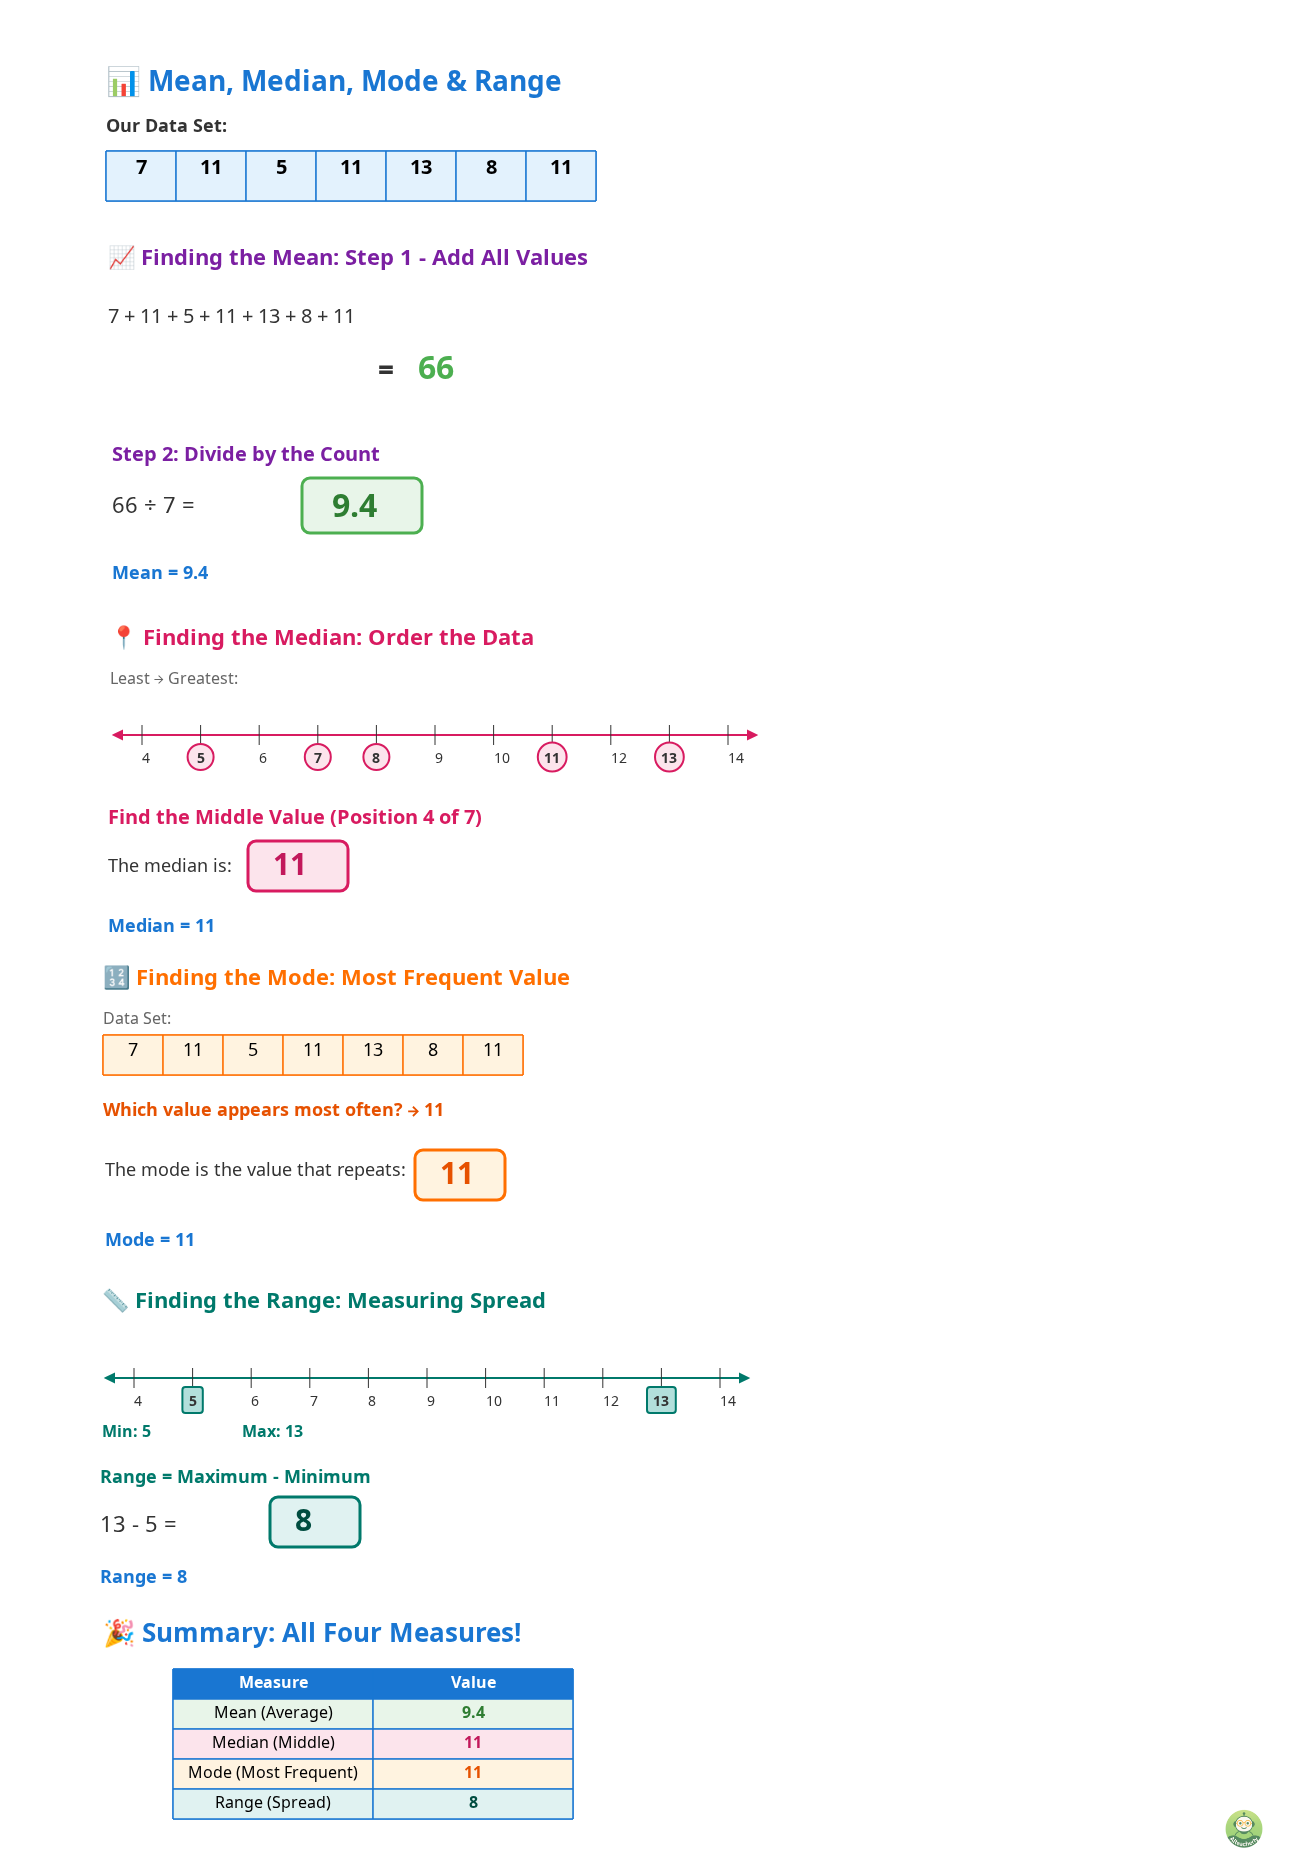
In the Mean, Median, Mode, and Range lesson for Grade 6, students work through carefully sequenced problems that build understanding step by step. The lesson uses a consistent data set throughout, allowing students to see how the same numbers can be analyzed in four different ways.
Here's what makes interactive learning effective for statistics:
Visual Learning Students see data arranged on number lines and in visual formats, making abstract concepts concrete. For median calculations, they physically see the process of ordering data before finding the middle value.
Immediate Feedback When a student makes an error, they learn right away rather than practicing mistakes. Common errors like forgetting to order data before finding the median are caught immediately.
Personalized Pace Students who grasp concepts quickly can move forward, while those who need more practice get additional problems without feeling rushed.
Real-World Contexts Problems incorporate scenarios like sports statistics, making the math relevant and engaging.
Here's what the full interactive lesson looks like on AI Teacherly:
Common Mistakes and How to Help Your Child Avoid Them
Knowing where students typically stumble helps you provide targeted support. Here are the most common mistakes 6th graders make with mean, median, mode, and range:
Mistake #1: Forgetting to Order Data Before Finding the Median This is the number one error. Students see a list like "9, 3, 7, 14, 7" and pick the middle number (7) without reordering. While they got lucky in this case, this approach fails with different data sets.
How to help: Make "order first" a mantra. Every time your child works on median, ask: "Did you put the numbers in order first?"
Mistake #2: Confusing Mean and Median Students often mix up these terms because both find a "middle" or "typical" value.
How to help: Use memory tricks:
- "Mean" sounds like "mean" (as in average Joe)
- "Median" sounds like "middle" and has the same first letters as "middle"
Mistake #3: Saying "No Mode" When Values Don't Repeat Some students try to pick a mode even when no value repeats. Others forget that multiple modes are possible.
How to help: Remind them: "Mode = Most Often." If nothing appears more than once, there's no mode. If multiple values tie for most frequent, list all modes.
Mistake #4: Subtracting in the Wrong Order for Range Some students subtract the largest from smallest, getting a negative number.
How to help: "Range = Highest minus Lowest" or "Big minus Small."
Mistake #5: Calculation Errors with Mean Adding incorrectly or dividing by the wrong number (like dividing by the sum instead of the count).
How to help: Encourage writing out the steps: "Add, Count, Divide." Double-check the addition before dividing.
Key Takeaways
- Mean (average) is calculated by adding all values and dividing by the count; think of it as the 'fair share' if everything were distributed equally
- Median is the middle value when data is ordered; always remind your child to arrange numbers from smallest to largest first
- Mode is the most frequently occurring value; a data set can have no mode, one mode, or multiple modes
- Range measures spread by subtracting the smallest value from the largest; it shows how consistent or varied the data is
- Use median instead of mean when outliers are present to get a more representative 'typical' value
- Practice with real-life examples like sports scores, test grades, and prices to make these concepts stick
- Interactive lessons with immediate feedback help students avoid common mistakes and build confidence faster
Frequently Asked Questions
What is the difference between mean and median?
Mean is the average calculated by adding all values and dividing by the count. Median is the middle value when data is ordered. Use median when outliers exist, as it better represents typical values without being skewed by extremes.
How do you find the mode if no number repeats?
If no value appears more than once in your data set, there is no mode. This is a valid answer. However, if multiple values tie for the highest frequency, all of them are modes.
Why do students need to order data before finding the median?
The median is specifically the middle value in an ordered list. Without ordering first, you'll identify the wrong number. This is the most common mistake students make with median calculations.
When should you use mean vs median to describe data?
Use mean when data is evenly distributed without extreme outliers. Use median when outliers exist, like with salaries or house prices, since it gives a better picture of the typical value.
What does range tell you about a data set?
Range shows how spread out the data is by measuring the difference between the highest and lowest values. A small range means values are clustered together; a large range indicates wide variation.
Is mean median mode and range on the 6th grade state test?
Yes, measures of central tendency are standard 6th grade math content tested on most state assessments. Students need to calculate all four measures and understand when to use each one.
How can I help my child practice mean, median, mode, and range at home?
Use everyday data like sports statistics, test scores, daily temperatures, or prices. Ask your child to calculate all four measures, then discuss what each one reveals about the data.
What are common mistakes kids make with measures of central tendency?
The top mistakes are forgetting to order data before finding median, confusing mean and median, and calculation errors when finding mean. Remind them: order first, check their addition, and verify division.
Ready to help your 6th grader master statistics? Try AI Teacherly's interactive Mean, Median, Mode, and Range lesson for free and watch their confidence grow with every problem they solve!